Census 2021 data reveals ethnic make up of UK population
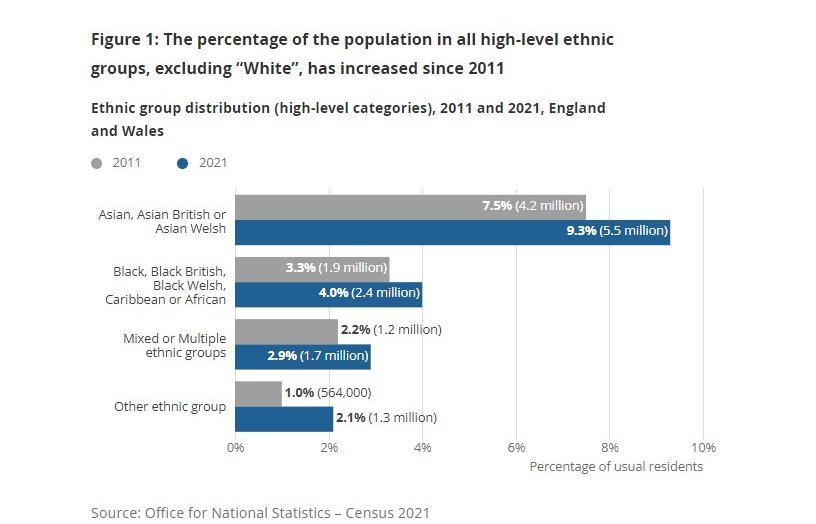
According to the 2021 Census, the total population of England and Wales was 59.6 million, and 81.7% (48.7 million) of the population was white, a decrease from 86.0% (48.2 million) in 2011, and 18% belong to a black, Asian, mixed or other ethnic group (2021 Census data), an increase from 13.8% in 2011. People from Asian ethnic groups made up the second largest percentage of the population (9.3%), followed by black (4.0%), mixed (2.9%) and other (2.1%) ethnic groups.
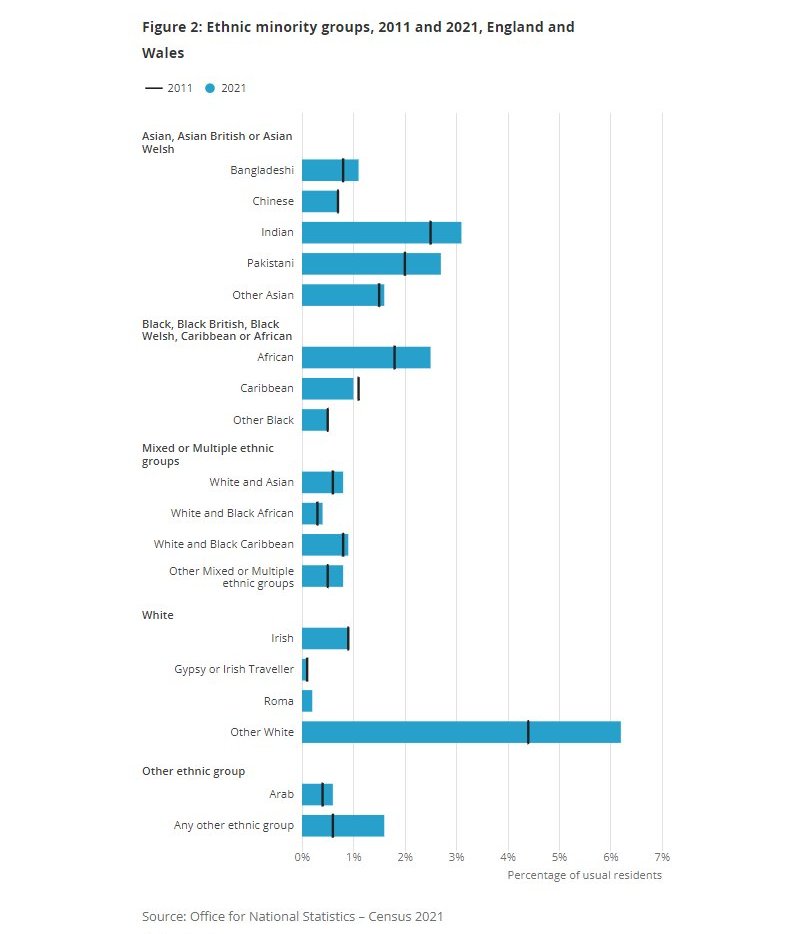
The largest increases were seen in the number of people who identified their ethnic group within the “Asian, Asian British or Asian Welsh” category (9.3%, 5.5 million in 2021, up from 7.5%, 4.2 million in 2011) and within “Other ethnic group” (2.1%, 1.3 million people in 2021, up from 1.0%, 564,000 in 2011).
There are many factors that may be contributing to the changing ethnic composition of England and Wales, such as differing patterns of ageing, fertility, mortality, and migration. Changes may also be caused by differences in the way individuals chose to self-identify between censuses.
Ethnic composition varied across England and Wales
England and Wales
In England the percentage of the population who identified within:
- the "Asian, or Asian British" ethnic groups was 9.6% (5.4 million)
- "Black, Black British, Caribbean or African" was 4.2% (2.4 million)
- "Mixed or Multiple ethnic groups" was 3.0% (1.7 million)
- "White" ethnic groups was 81.0% (45.8 million)
- "Other ethnic groups" was 2.2% (1.2 million)
In Wales the percentage of the population who identified within:
- the "Asian, Asian British or Asian Welsh" ethnic groups was 2.9% (89,000)
- "Black, Black British, Black Welsh, Caribbean or African" was 0.9% (28,000)
- "Mixed or Multiple ethnic groups" was 1.6% (49,000)
- "White" ethnic groups was 93.8% (2.9 million)
- "Other ethnic groups" was 0.9% (26,000)
Ethnic Diversity Statistics for the Cities in England and Wales
A separate study also analysed the census 2021 data to find the population percentages for each ethnicity in each city, revealing the 10 most ethnically diverse cities to live in England and Wales. The cities and their ethnic minority percentages were:
- Westminster, 72%
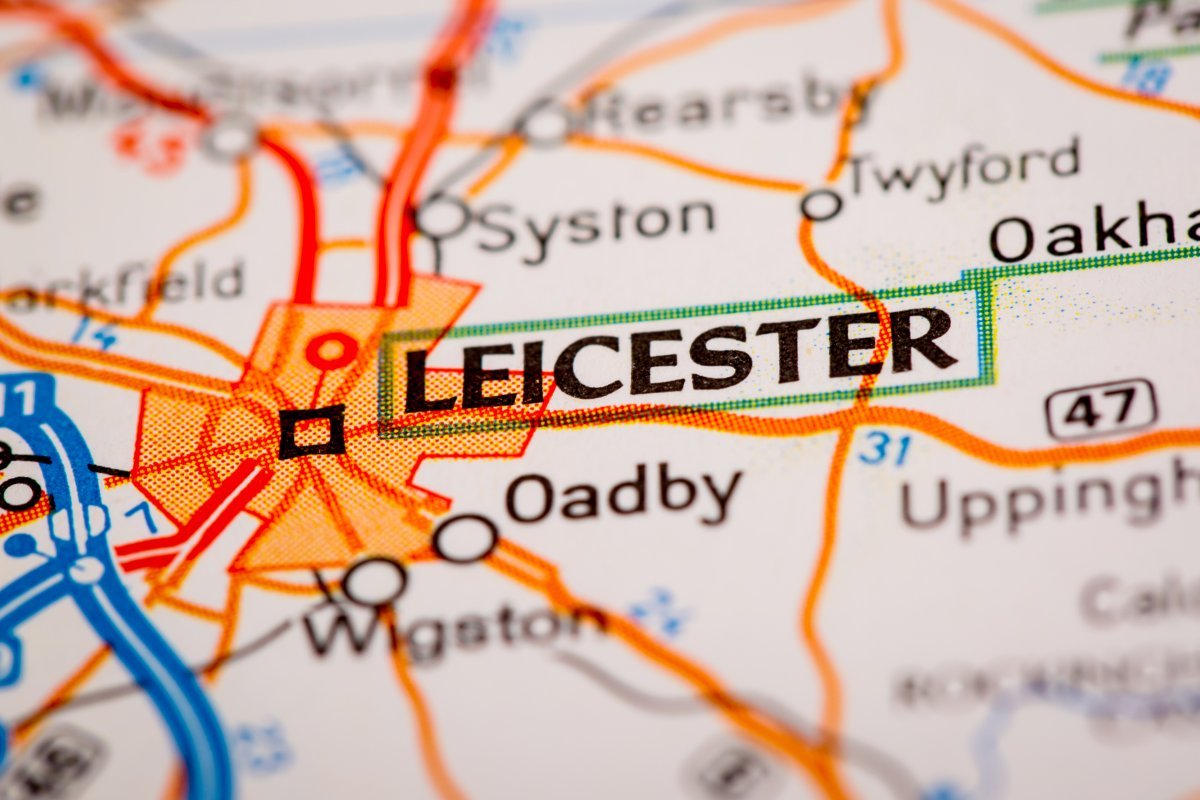
- Leicester, 67%
- City of London, 67%
- Birmingham, 57%
- Manchester, 51%
- Cambridge, 47%
- Oxford, 47%
- Wolverhampton, 45%
- Coventry, 45%
- Bradford, 43%
On 29 November 2022 the Office for National Statistics (ONS) published a suite of Census 2021 bulletins, which give insight into the cultural identity of people in England and Wales in March last year. These cover ethnic group, national identity, language and religion.
"The census provides a unique and comprehensive understanding of everyone's self-defined cultural identity, which in turn leads to a more accurate picture of the population," Census Deputy Director Jon Wroth-Smith said.
"Today's data highlights the increasingly multi-cultural society we live in. The percentage of people identifying their ethnic group as 'White: English, Welsh, Scottish, Northern Irish or British', continues to decrease. Whilst this remains the most common response to the ethnic group question, the number of people identifying with another ethnic group continues to increase.
"However, the picture varies depending on where you live. London remains the most ethnically diverse region of England, where just under two-thirds identify with an ethnic minority group, whereas under 1 in 10 identify this way in the North East.
"But despite the ethnically diverse nature of society, 9 in 10 people across England and Wales still identify with a UK national identity, with nearly 8 in 10 doing so in London."
Fewer people with a religious identity
Mr Wroth-Smith added: "The results show that there are fewer people who have a religious identity. More than 22 million people – an increase of 8 million since 2011 – said they had 'No religion'. And for the first time in a census of England and Wales, less than half of the population reported their religion as Christian, although it remained the most common response."
English remains the dominant language
"English (English or Welsh in Wales) remains the dominant main language, but Polish, Romanian, Panjabi and Urdu are other common main languages spoken. Again, the picture varies across England and Wales. The number of people who reported Romanian as their main language has seen the largest percentage increase, which mirrors the rise in Romanian-born people living here since the last census."
For further information, visit https://www.ethnicity-facts-figures.service.gov.uk